
We are pleased to present results from the DARTS project at the Human-In-the-Loop Data Analytics Workshop at this year’s SIGMOD in Berlin.
In cooperation with SIEMENS Energy, the DARTS research project is investigating methods for time series integration. These methods are an elementary step towards being able to analytically evaluate complex technical systems, such as power plants, and make the data usable.
The paper argues that much research in the field of time series integration is all about theoretical methodologies, but the user is not yet sufficiently in focus. Consequentially, the research has not yet found widespread adoption albeit aiming at the very practical issue of time series integration. Building on this, we discuss which steps are necessary for a practical adaption of the research and present visualization methods that make the methodological results more tangible.
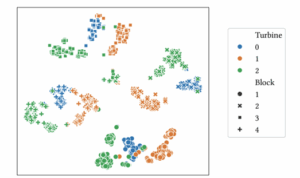
Fig.: t-SNE visualization of all signals from a combined-cycle power plant (four blocks à three turbines.)
Abstract
Cyber-physical systems such as buildings and power plants are increasingly monitored using large numbers of sensors, resulting in massive and heterogeneous time-series datasets. High-quality metadata – particularly measurement type and functional location – is essential to extract value from this data. However, such metadata is often incomplete or missing. While recent research addresses the issue of recovering functional location from raw time-series data, it focuses on discovering pairwise relationships and provides little guidance for end-users on how to apply these methods.
From the user’s perspective, we identify three open challenges in the current research on functional location inference: selecting the appropriate relationship discovery algorithm, minimizing computational effort, and interpreting the results to assign locations. We examine each challenge in detail and explore potential solutions. As a first step towards interpretability, we demonstrate how to visualize pairwise similarities using matrix and scatter plots to keep the user in the loop. Using seven datasets and five pairwise relationship measures, we find that simulated annealing is effective for matrix reordering, while t-SNE and UMAP provide the best two-dimensional embeddings for preserving local structure.